v0.10
The Elasticsearch alternative without the 24/7 server costs.
Search engines
shouldn't cost
a fortune.
Flatseek is a search engine without always-on infrastructure.
No JVM, no clusters—just query CSV, JSON, or XLSX directly, from daily use to production scale.
Run massive datasets across domains — transactions, logs, metrics, events, and analytics. Ingest from CSV, JSON, and index dumps. Automate pipelines, scale with parallel workers, and serve via REST API.
›››[(b["key"], b["doc_count"]) for b in agg.aggs["by_program"]["buckets"]]
[('raydium', 892147), ('jupiter', 721089),
('orca', 431202), ('meteora', 289401)]
Live UI · Flatlens
Or stay in the browser. Drop, query, chart, map.
Flatlens is the dashboard that ships with Flatseek. Drop a file and you get a working search engine, aggregations, and a world map — without typing a single command.
/dashboard
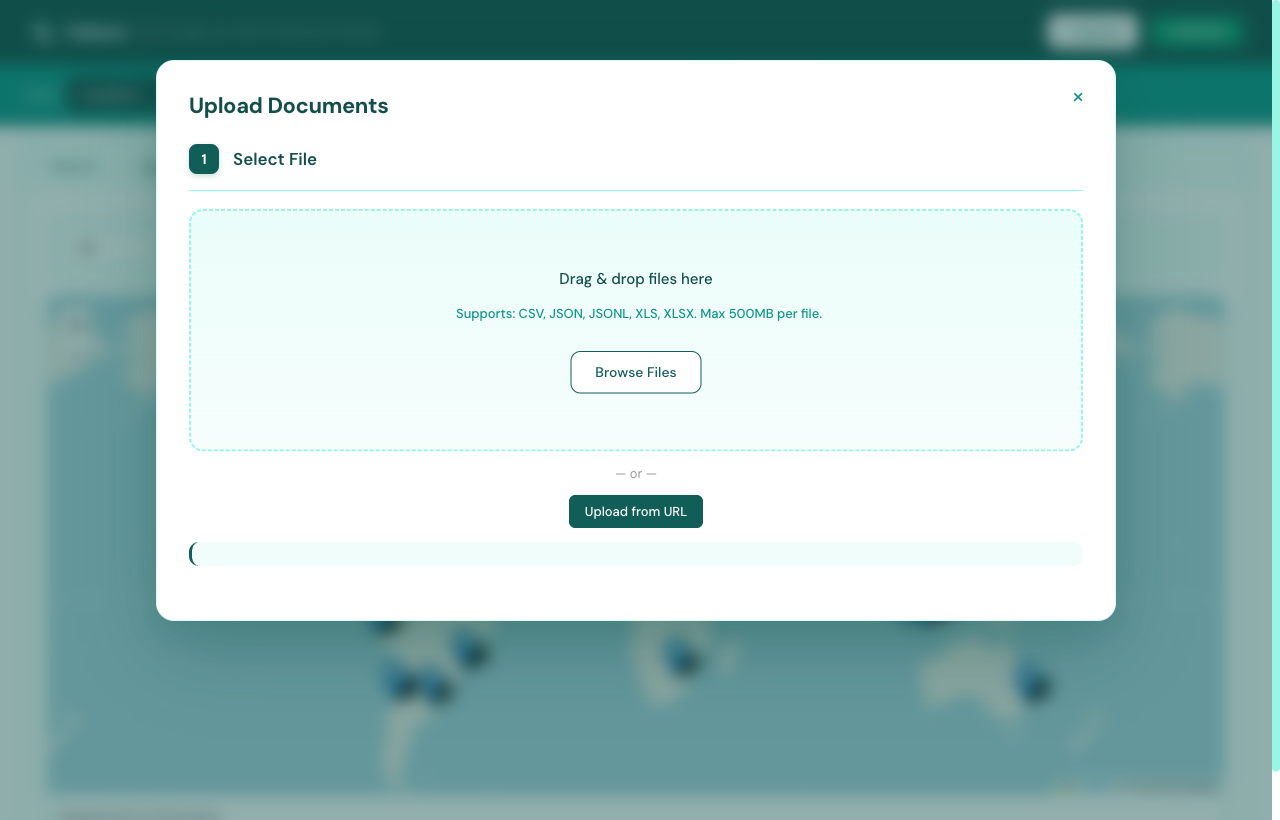
Step 01 / Drop the file
Drag a file in. That's it.
Open the dashboard, hit + Upload, and drop a CSV, JSON, JSONL, XLS, or XLSX up to 500 MB. Or paste a URL.
CSV, JSON, JSONL, XLS, XLSX
Up to 500 MB per file
Upload from local disk or URL
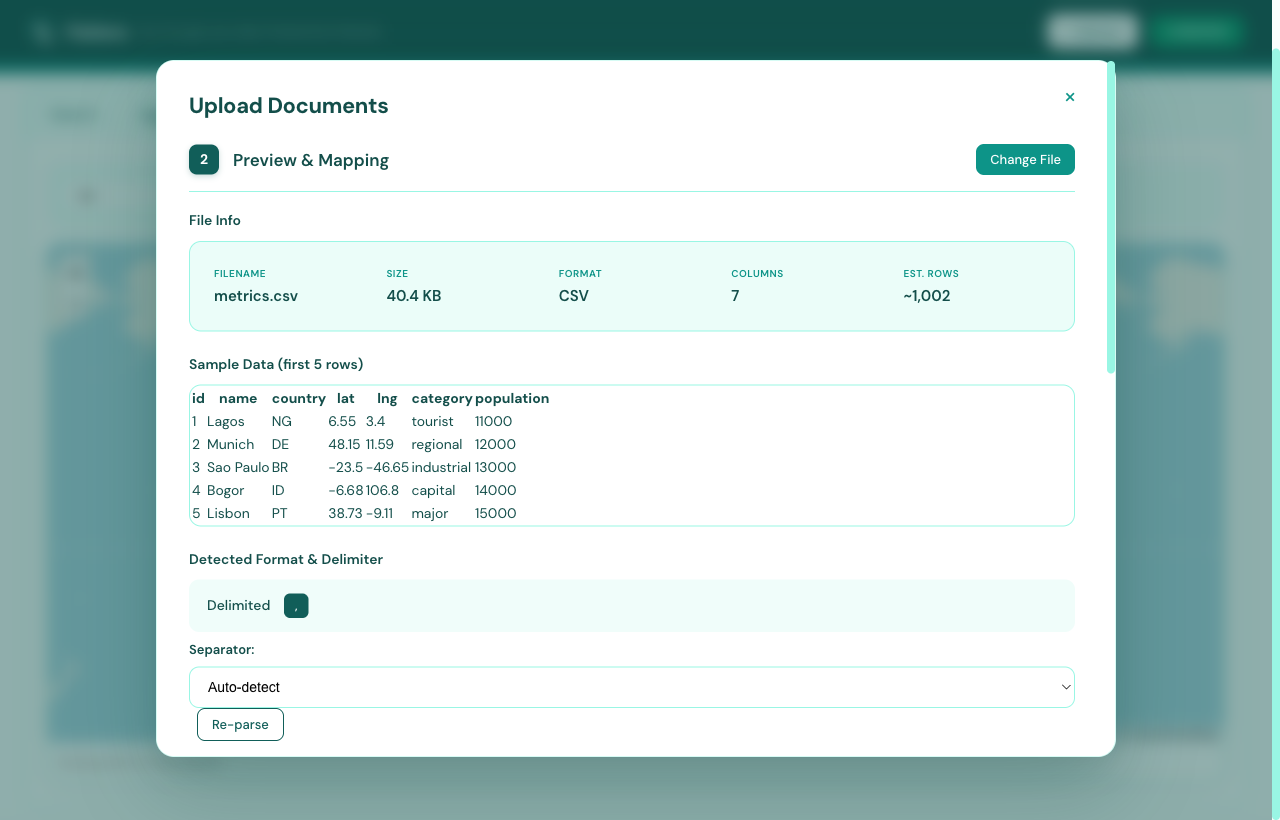
Step 02 / Verify
Inspect before you commit.
Flatlens reads the first rows, detects file size, format and delimiter, and estimates total docs — so you know what's coming.
First-100-row preview
File size, format & column count
Auto-detected delimiter
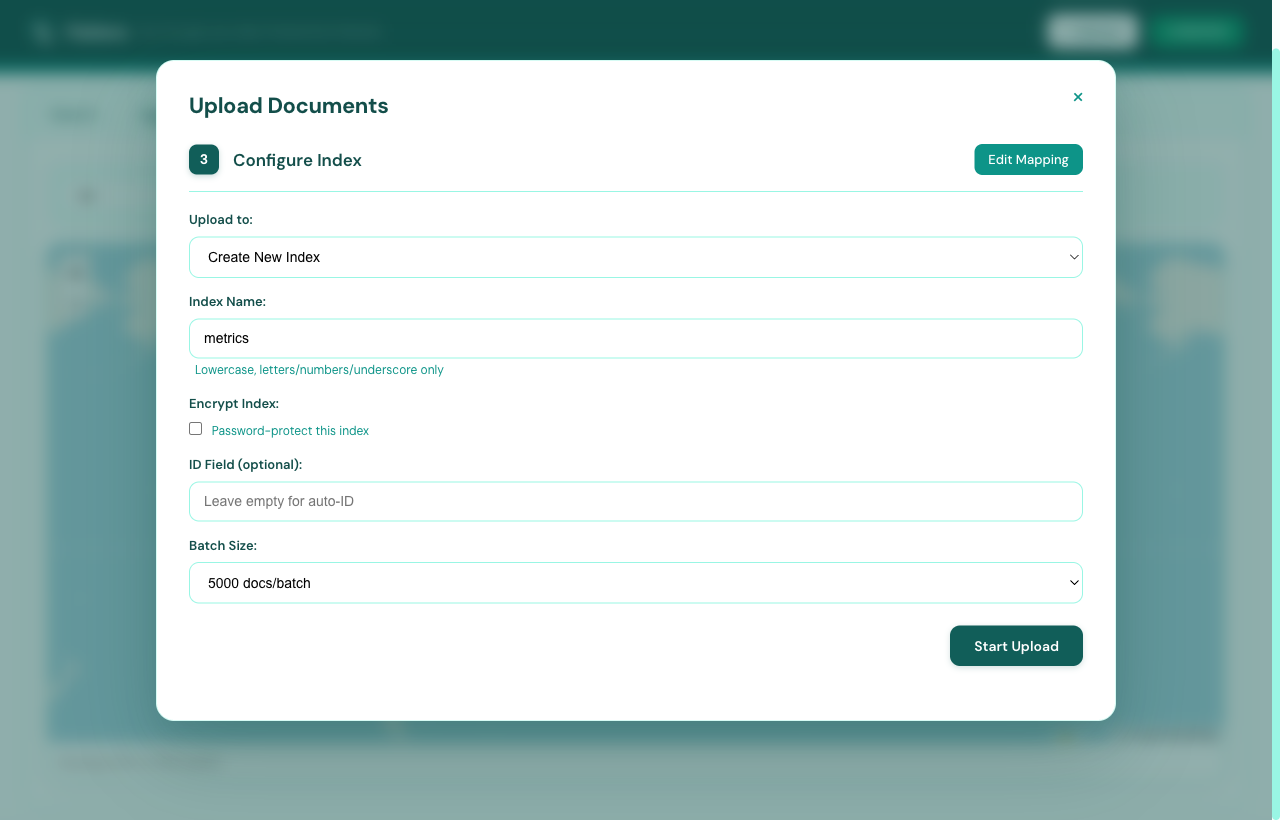
Step 03 / Configure
Name it. Lock it. Ship it.
Pick a target index, set a passphrase if the data is sensitive, choose an ID field, and tune the batch size. Defaults are sane.
Create new or append to existing
Optional ChaCha20 encryption
Custom ID field & batch size
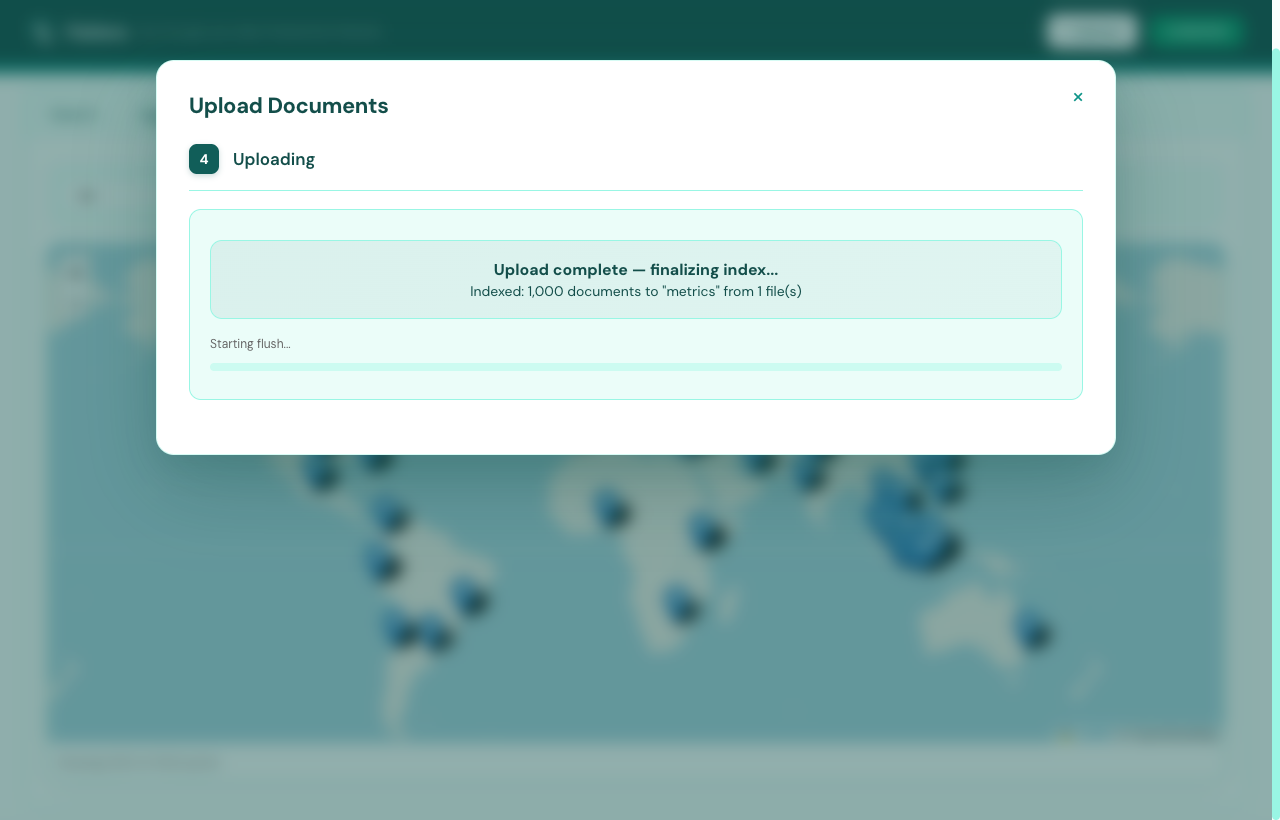
Step 04 / Watch it build
Live progress, honest ETA.
Streamed progress with elapsed, ETA, and live doc count. Nothing fake — the numbers come straight from the indexer.
Per-file progress bar
Elapsed & ETA, no estimation tricks
Resumable on interrupt
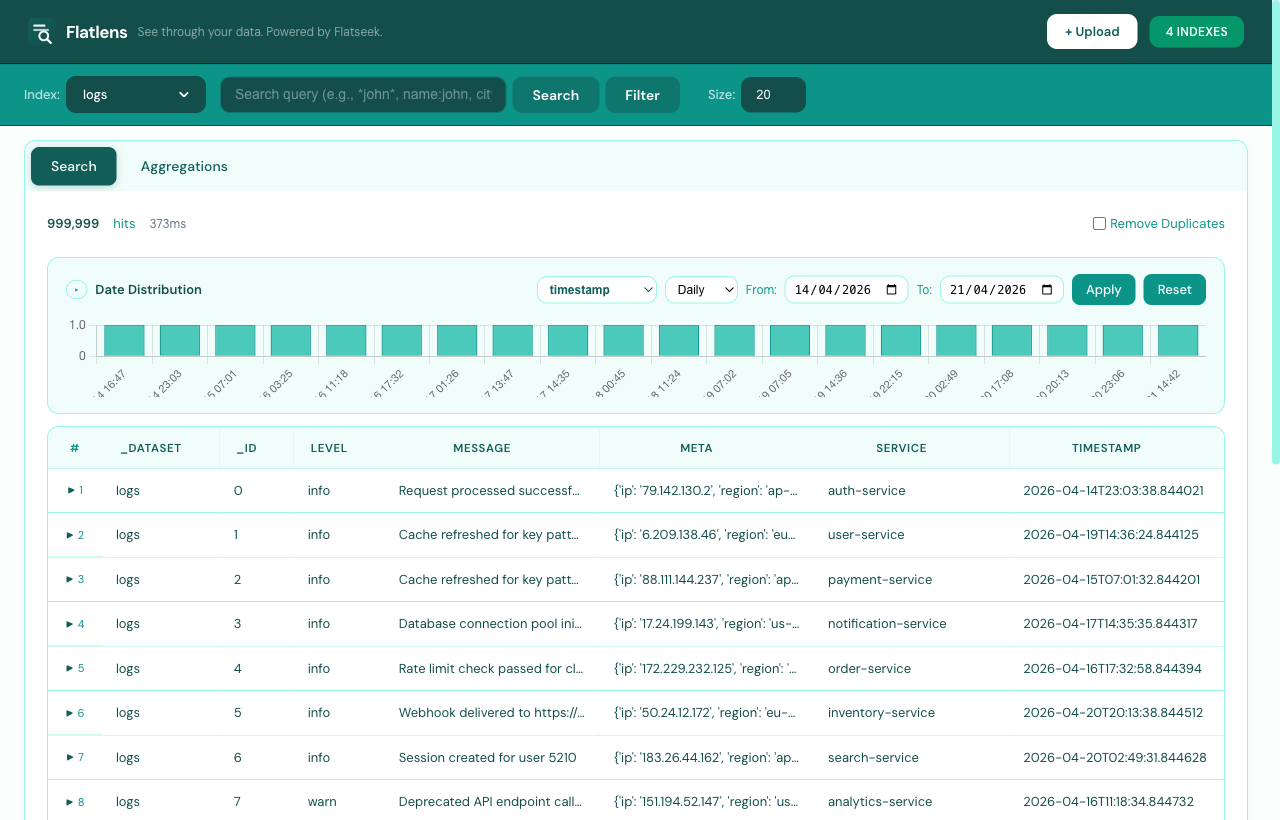
Step 05 / Search
Lucene-style queries, without a build step.
Type a query, hit Search, get hits in milliseconds. The date histogram on top updates with every refinement.
Wildcards, fuzzy, AND/OR/NOT
Live date-range distribution
Visual filter builder
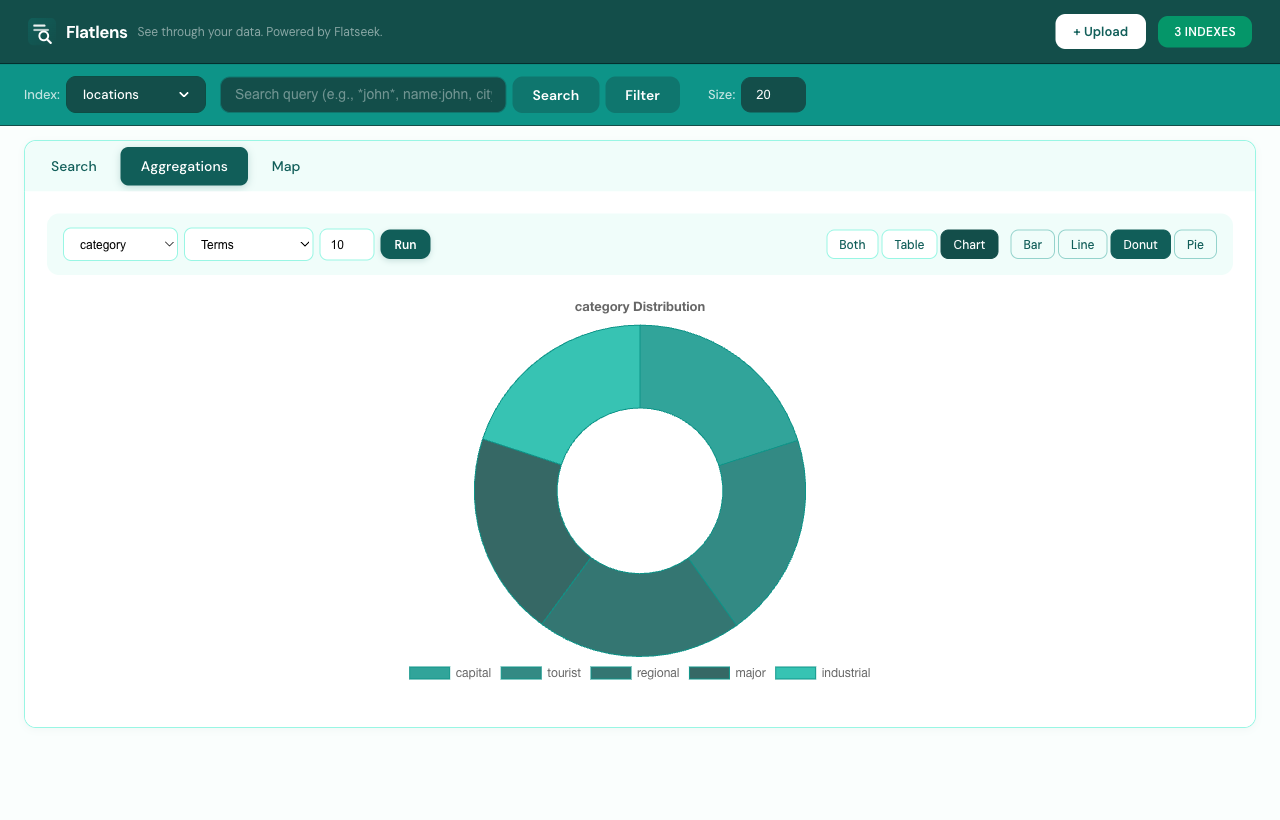
Step 06 / Aggregate
Charts, on disk, in real time.
Pick a column, an aggregation type, and a chart shape. Aggregations run against the trigram index — no docs loaded into RAM.
Terms, stats, date-histogram, cardinality
Bar, line, donut, pie
Hover tooltips with exact counts
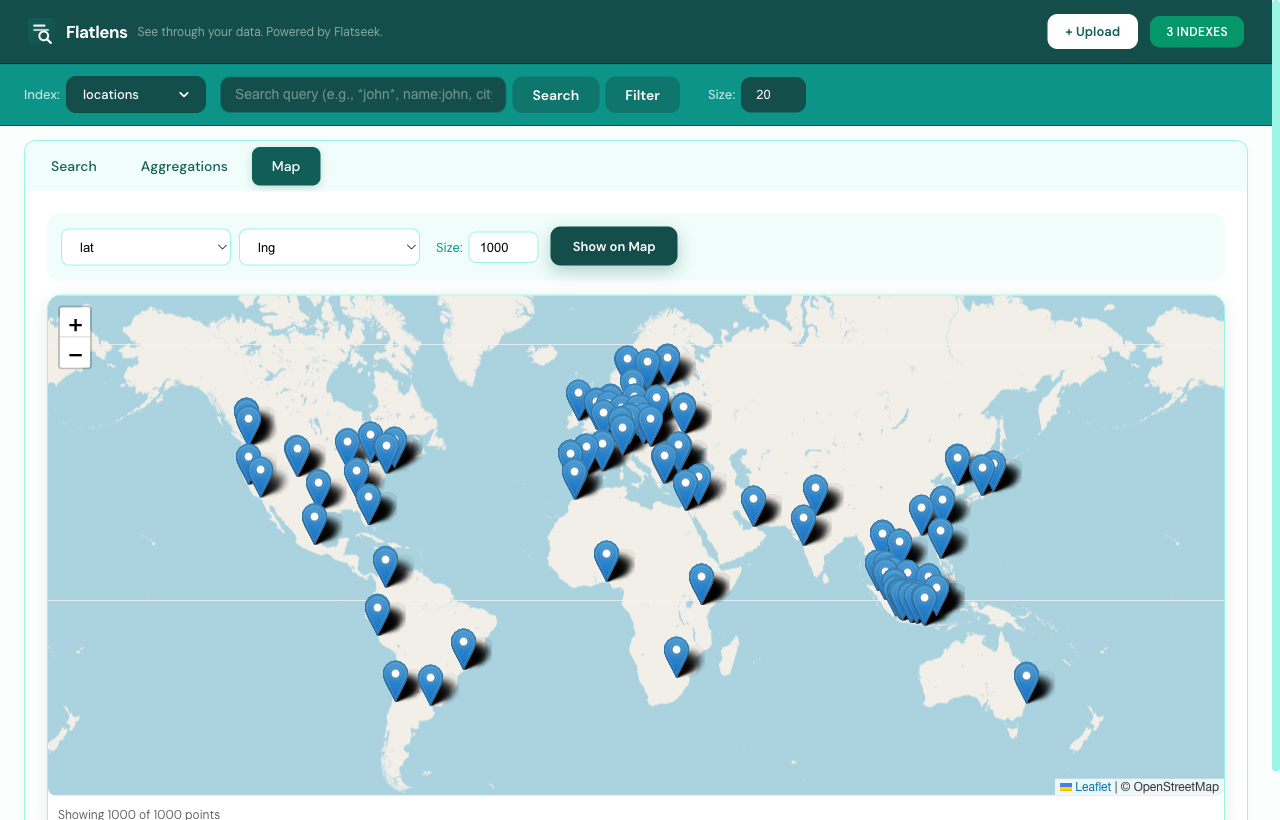
Step 07 / Map
Plot every geo-point.
Pick lat & lng columns, set a sample size, and Flatlens drops your dots on a Leaflet map — with clustering up to 50,000 points.